US Airline Passenger Statistics Mapped
Visualizing airline routes weighted by passenger counts in 2016
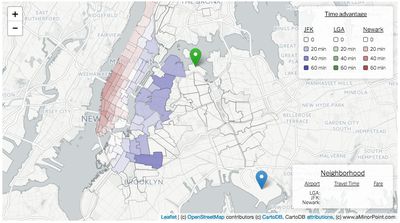
The map below shows airline routes weighted by the number of passengers traveling those routes. Busier routes show up as wider, redder lines with less transparency while routes with fewer passengers are thinner, bluer lines that are faintly visible.
You can select by airline, by airport, and by geographic region.
If you like what you see, feel free to share it. If you have a question or suggestion, please use the link at the bottom to get in touch.
Interesting tidbits
The route between San Franciso (SFO) and Los Angeles (LAX) was the busiest domestic route in 2016 with about 3.7 million passengers. Between New York City (JFK) and Los Angeles (LAX) was the second busieset route with almost 3.5 million passengers and between Chicago (ORD) and New York (LGA) was the third busiest with about 3.0 million passengers.
Orlando's theme parks create a big draw. Despite being a relatively small metro area, travel between Atlant (ATL) and Orlando (MCO) was the fifth busiest domestic route in 2016 with about 2.8 million passengers.
The route between New York City (JFK) and London (LHR) was the busiest international route in 2016 with almost 2.9 million passengers.
The second busiest international route was between Honolulu (HNL) and Tokyo (NRT) with about 1.6 million passengers. Between Los Angeles (LAX) and London (LHR) was the third busiest with about 1.5 million passengers.
About the map
The data comes from the United States Department of Transportation's Bureau of Transportation Statistics. They collect route information for each trip that involves an airport in the United States for both domestic and foreign carriers.
The data is a whittled down version of what's available. I imposed the following constraints to make it a bit easier to handle:
The data was restricted to airlines that carried at least 100,000 passengers in 2016.
Routes that carried fewer than 50 passengers per week were excluded.
Route pairs were collapsed into a single route. For example, passengers flying from JFK to LAX were grouped with passengers flying from LAX to JFK.
The airline classifications are a bit rough. Also, if you aren't too familiar with airlines, some of the regional airlines operate flights on behalf of the main carriers. For example, Piedmont Airlines is wholly owned by American Airlines, but operates its own flights under an American brand out of Charlotte, NC and Philadelphia, PA. I chose not to consolidate regional airlines with mainline airlines since some of the regional airlines operate flights for multiple airlines. For context, the mainline airlines carried about 676 million passengers in 2016 compared to the regional airlines carrying about 147 million passengers.
If you have come across similar data for other countries please let me know about it and I'll try and add it to the map.