The decline of manufacturing in the US... wait, what decline?
Looking at manufacturing output and efficiency over the last twenty years
A previous post looked through the decline in manufacturing employment in the US at the state and county level. In this post we'll look at manufacturing output and see how it compares, paying particular attention to changes in efficiency in terms of output per employee.
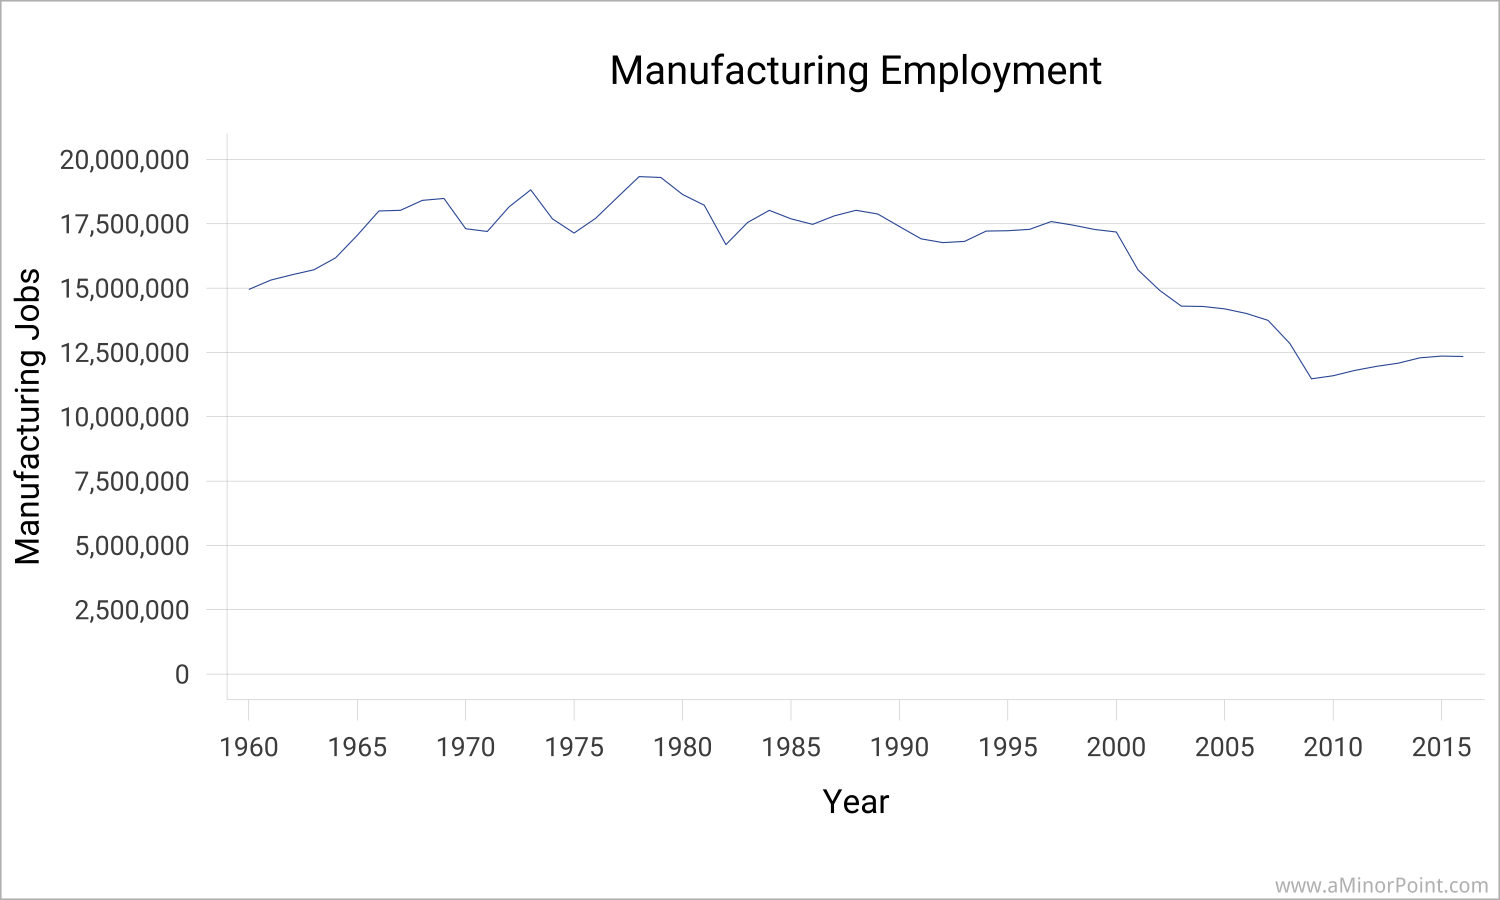
As a reminder, manufacturing employment in the US peaked at around 19 million in the 1970s. It remained around 17.5 million until the late 1990s, when the recessions in 2001 and 2007-2009 saw manufacturing employment decline sharply, but never fully recover.
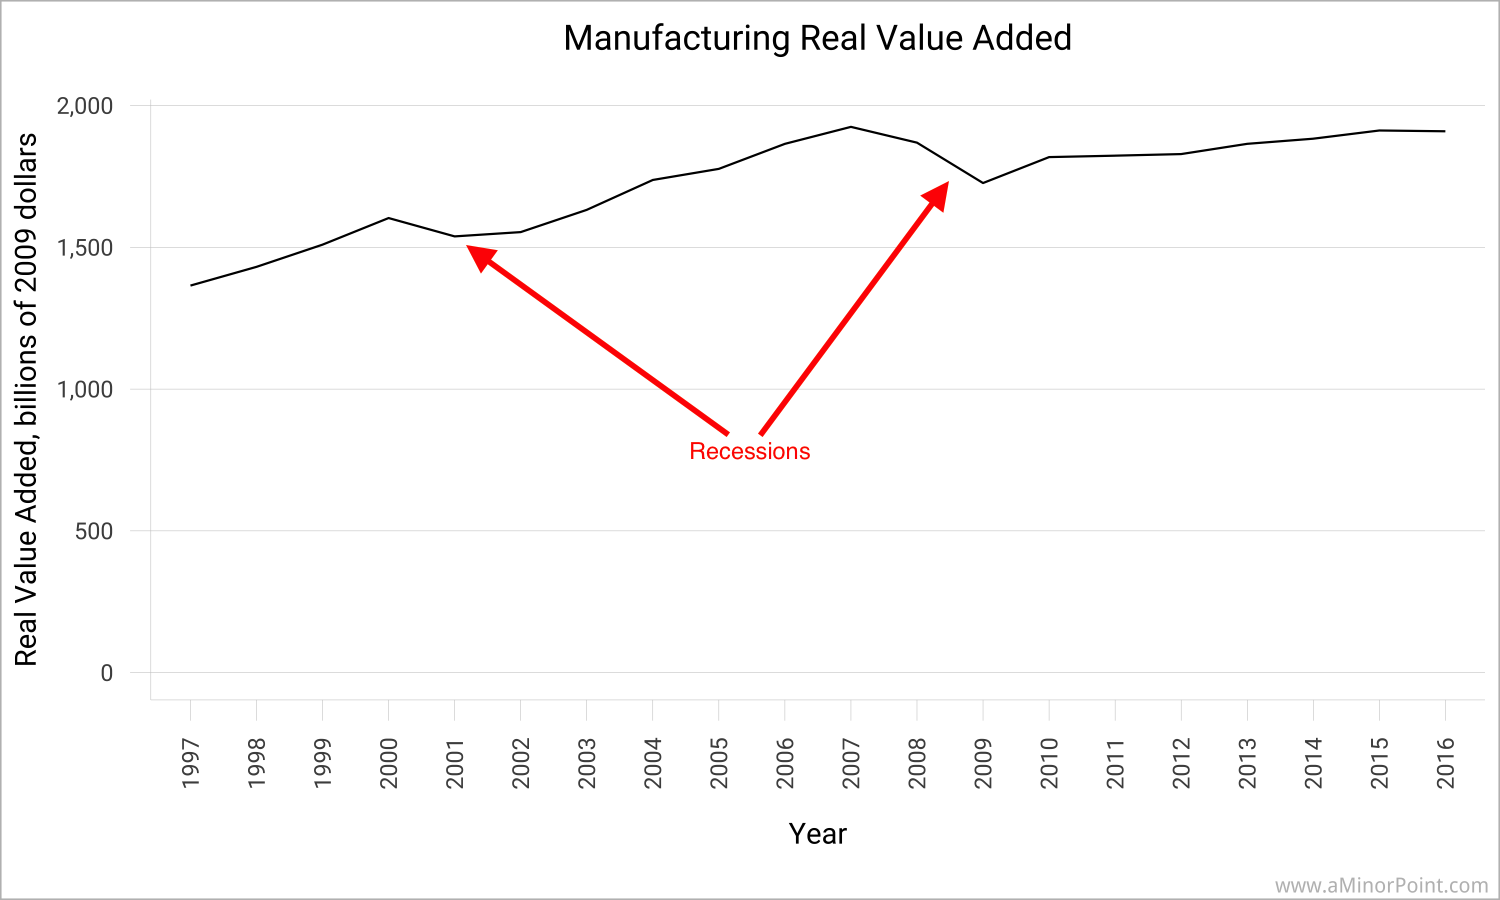
Let's move on to look at what the manufacturing sector produces. To do this, we'll look at output in terms of "real value added" where "real" is basically trying to strip out the impact of inflation. "Value added" is based on the concept of the value a company adds to the purchased inputs. For example, if company X buys $40 worth of stuff and sells its output for $60, it's "value added" is $20. This is the same concept for how manufacturing, and other sectors of the economy, sum up to GDP.
So let's have a look below. Since 1997, manufacturing real value added has increased on average 1.8% per year, or 40% in total.
But manufacturing is a pretty broad concept. We can dig one level deeper to look at durable goods manufacturing, and nondurable goods manufacturing.
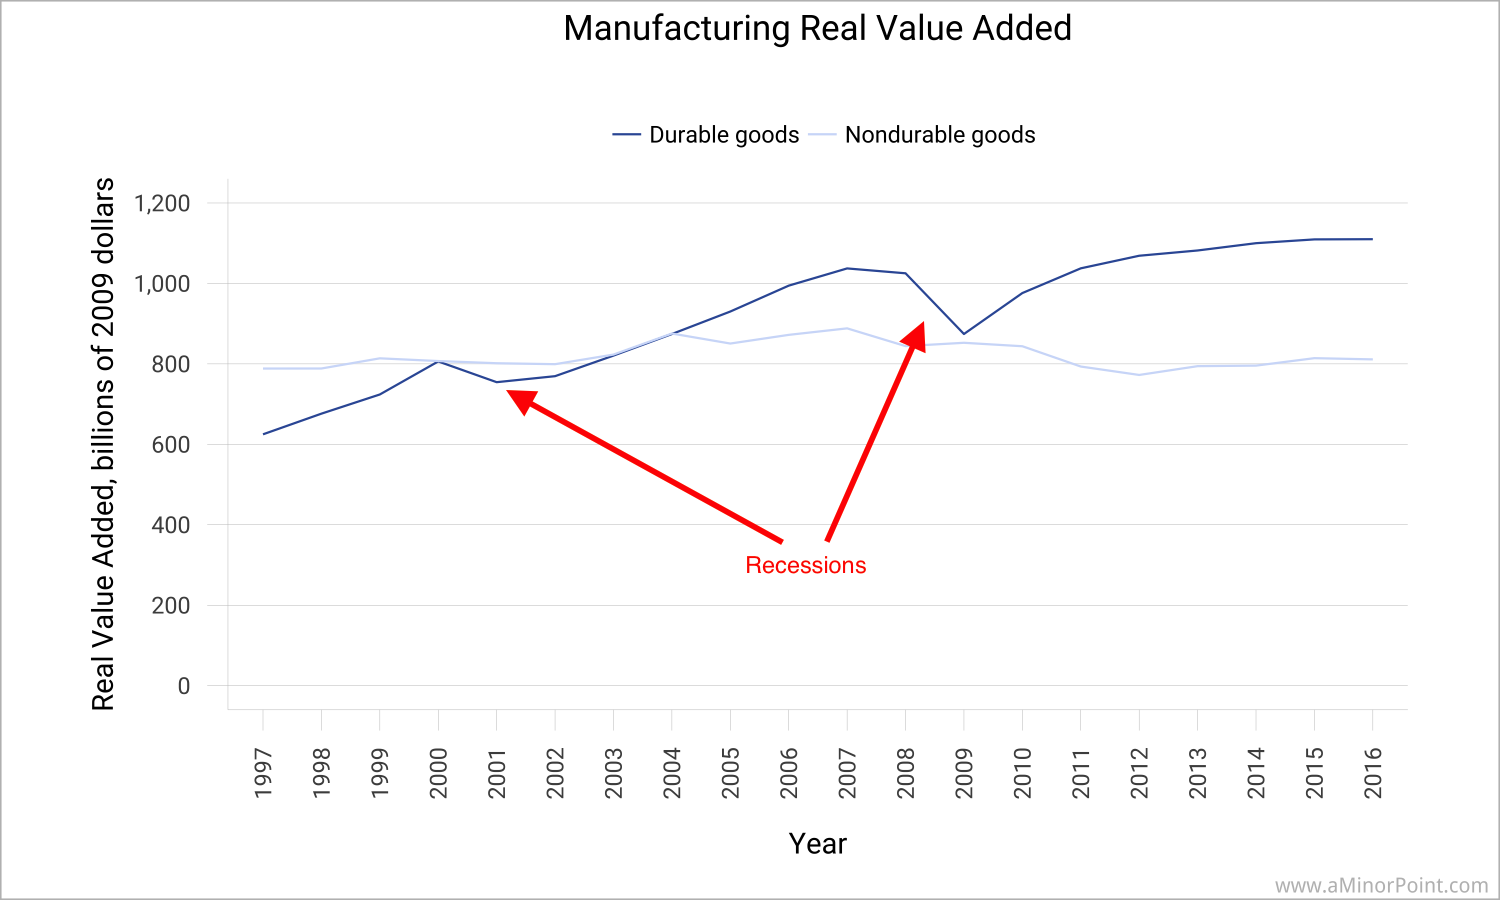
That paints a bit of a different picture. Durable goods manufacturing increased 78% since 1997, or about 3.1% per year on average. Nondurable goods manufacturing on the other hand only increased 2.9% over the same period, or about 0.2% per year on average!
That's still pretty broad though to get a solid understanding of what's been going on. We can again dig one level deeper as shown below.
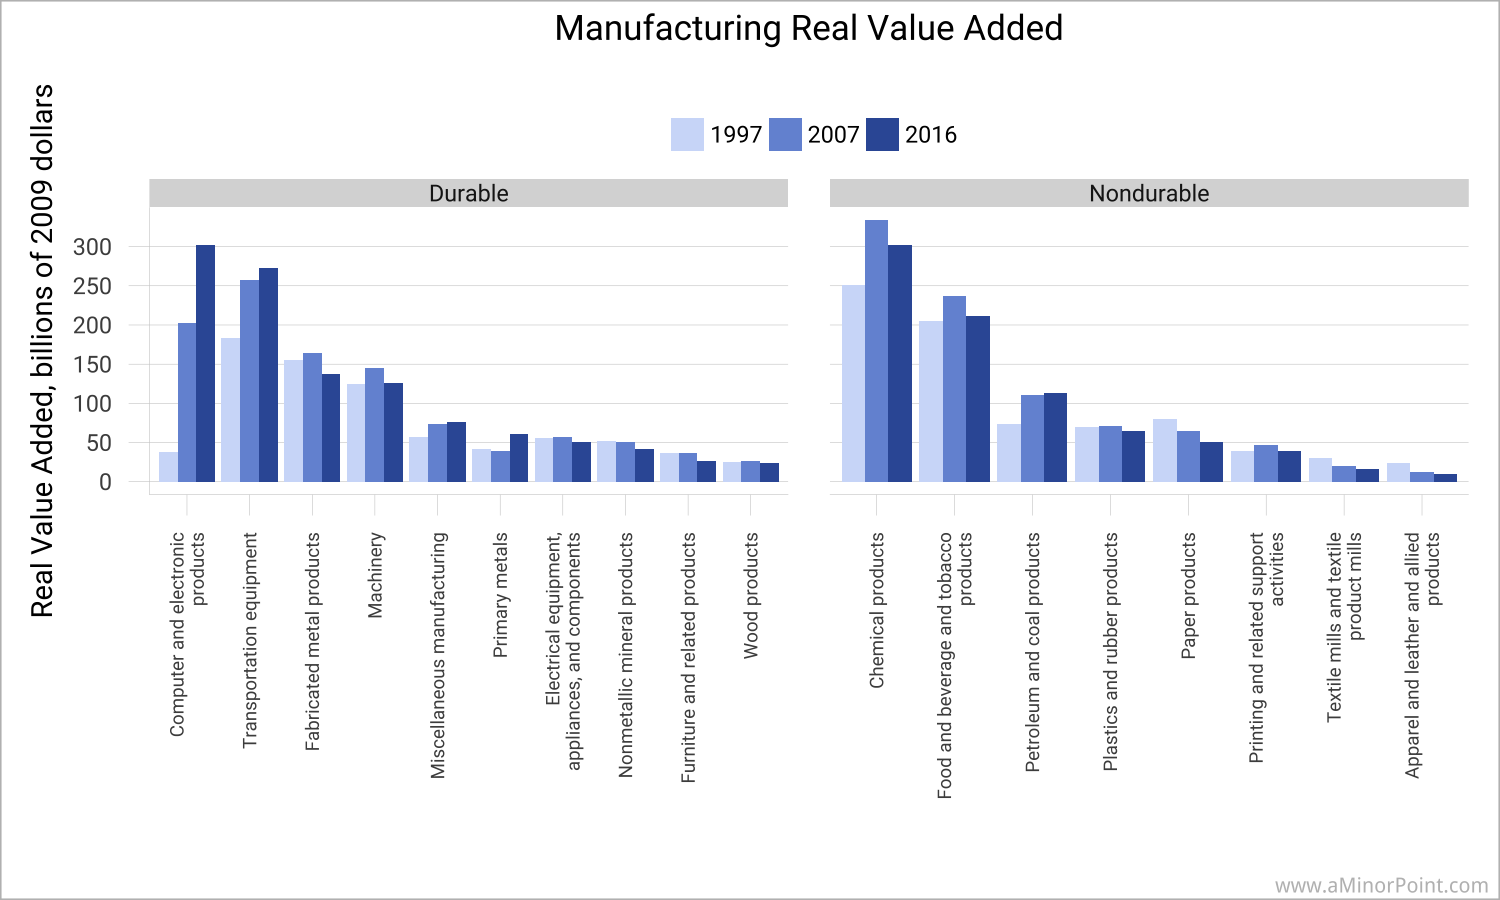
Now we can start making some more detailed observations. We can see that the biggest manufacturing industries in the US in terms of real value added are computer and electronic products, transportation equipment, chemical products, and food and beverages.
In terms of growth, we can see that the big driver, by far, of increases in durable goods manufacturing comes from computer and related products (think semiconductors). Transportation (planes, trains, and automobiles) is the other big driver. Comparing to 2007 just before the Great Recession paints a bit more mixed picture. The growth drivers are the same, but there are several industries where output has not yet fully recovered.
On the nondurable goods side, we can see that chemical products and petroleum products (basically refining) have increased, but a number of categories have declined. Notably, most industries have not recovered to their 2007 levels. Some of these are likely structural, such as paper products and the decline of print media and advertising and the rise of digital media.
So now we know that manufacturing real value added has been increasing. We also know from before that manufacturing employment has been decreasing. So if we combine those two facts, it must mean that efficiency per employee has been increasing (a more refined approach would be to look at value per hour of work, but I think it's easier to understand from an employment standpoint). We can combine a couple of a data sets to show just that in the chart below.
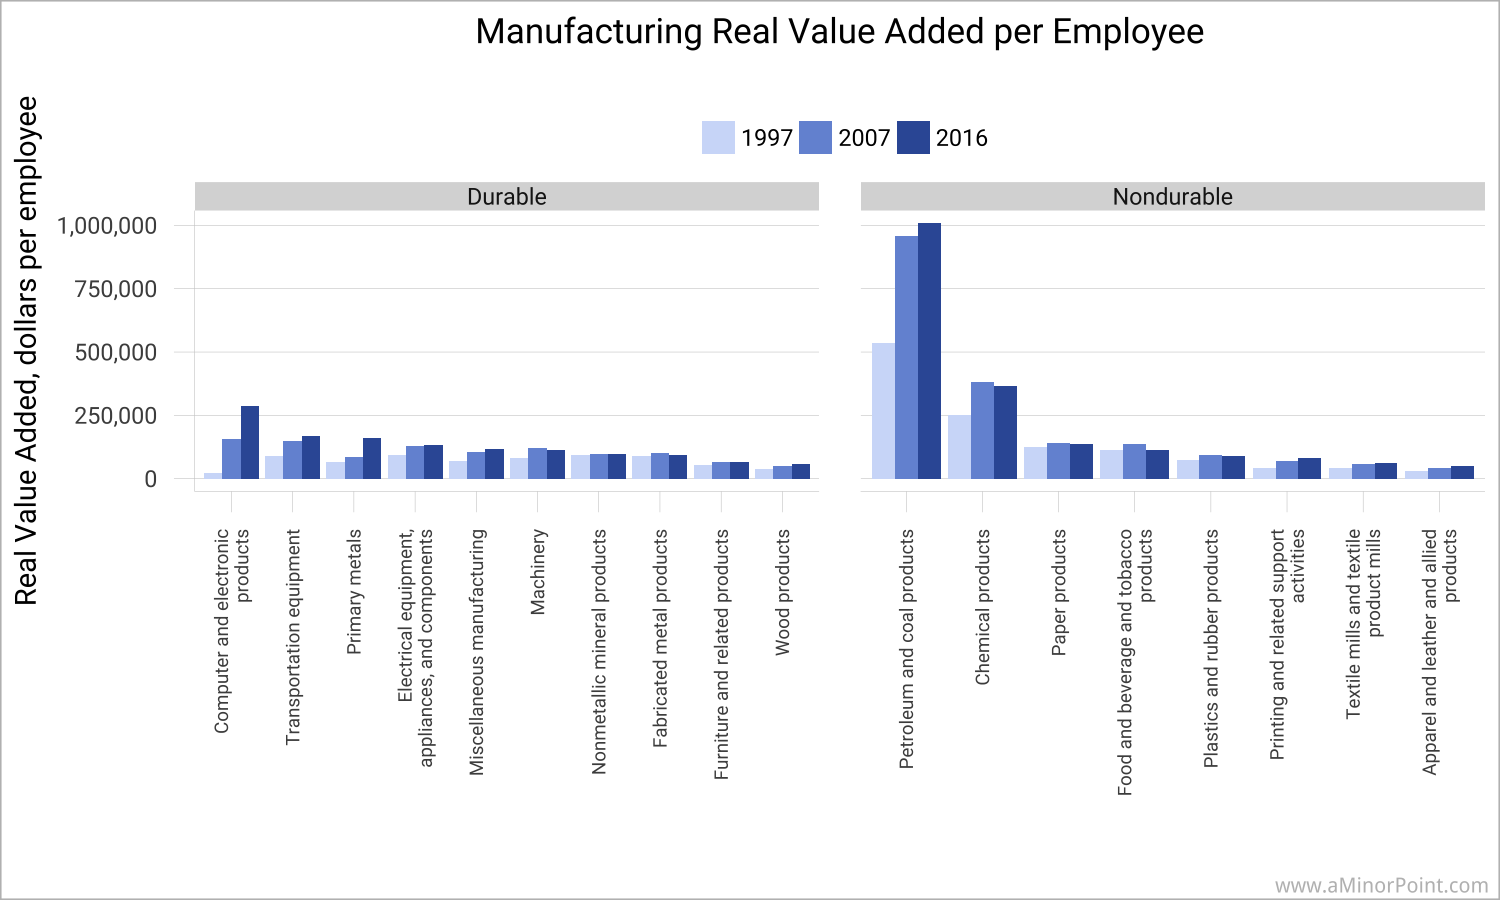
That chart isn't very easy to read due to petroleum products. If you've ever driven by a refinery, you'll see lots of capital investment in place, but not a lot of people working there. So the chart below repeats the above chart, but excluding petroleum products.
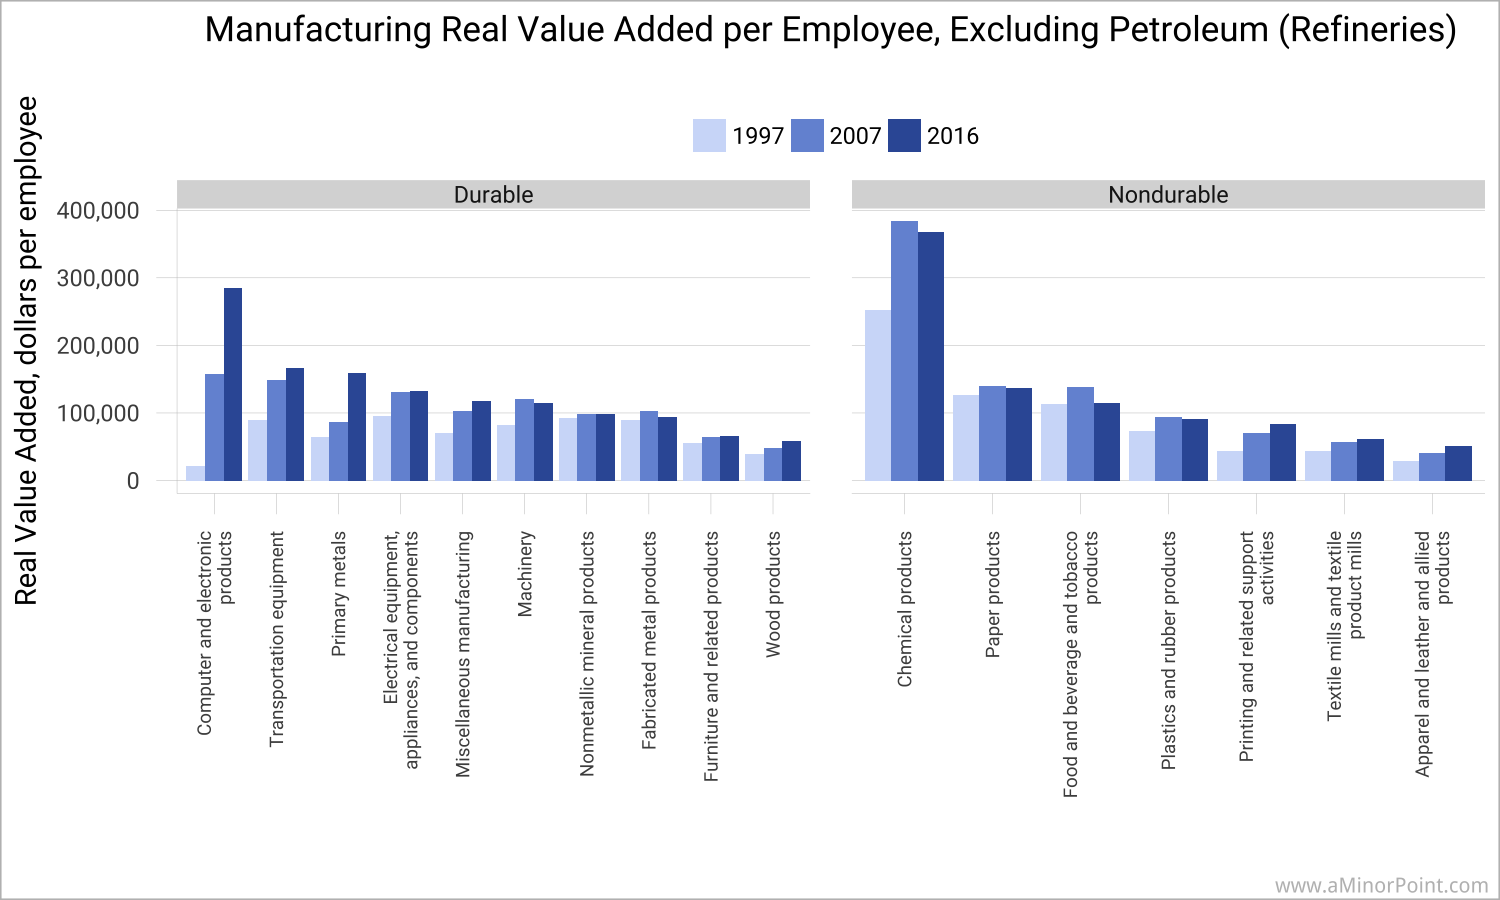
As you can see, there have been major efficiency improvements across almost every category of manufacturing since 1997, though it's a bit more mixed when the starting point is 2007.
What is notable though is that the industries that have seen increases in real value added since 2007 (computers and electronics and transportation equipment) are also the most efficient in terms of real value added per employee. On the other hand, the industries that have seen the most declines in real value added since 2007 tend to be less efficient, resulting in a greater amount of job losses.
So overall, there has been a decline in manufacturing employment. But manufacturing output, as measured by real value added, has actually been increasing, though unevenly. It just hasn't been perceived to be all that great since all the gains in manufacturing output are coming in industries that are the most efficient, so it hasn't resulted in a big increase in manufacturing employment. But it's incorrect to say that manufacturing as a whole is in decline.