Exploring Small Business Employment
Using statistics from the Census Bureau to better understand small business employment growth by state and industry across the US
Small businesses have long been heralded as the engine of job creation in America. But is that still the case today? And “small business” is very broad. What about by industry? And by state? Is a small business job created in California the same as one created in Virginia? This post attempts to lay out the data in an accessible manner to help you understand the current state of affairs.
First, we need to define a “small business”. The US Small Business Administration defines it by industry, but roughly speaking it is a business that employs less than 500 employees or generates less than $7.5 million in annual revenue. That official definition is used to allow small businesses access to federal programs. For our purposes here, I’m defining “small business” as a company with fewer than 500 employees, which also fits nicely with slicing the data.
Job creation by small businesses
Now let’s move on to job creation. Since 1998, business of all sizes created about 16 million jobs. Of those 16 million, about 3.9 million were created by small businesses. The most jobs were created by companies employing 10,000 or more people, coming in at about 7.3 million jobs. A similar pattern holds when looking at job creation since the last recession. Since 2010, small businesses created 3.8 million jobs while businesses with 10,000 or more employees created 4.8 million jobs.
This divergence in growth trends has caused small business employment as a share of total employment to dip below 50%. The size of the annual declines are fairly small, but the trend is clear.
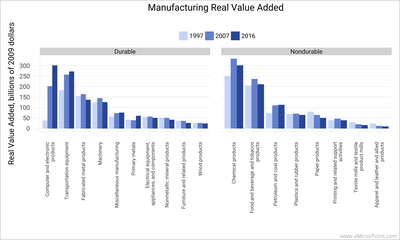
But that national and consolidated view masks some significant disparities when looking at individual industries. The performance of each industry varied widely in the 2000s. Construction was one of the drivers of small business employment during the housing boom, and when that went bust, so did small business construction employment. There were also secular trends that were amplified by the recession, mainly the increasing dominance of Walmart and Amazon in retail and the declining employment in manufacturing (which I explored further here and here). Notably, certain industries were very resilient and continued to employ more people throughout the recession.
We can also look to see which industries are predominantly made up of small businesses. Continuing on the construction theme, in 2015 about 82% of employees working in construction worked for a small business. Other industries that are predominantly made up of small businesses are the generic Other Services along with Real Estate and Arts & Entertainment. At the other end of the spectrum, very few businesses in Finance, Information, and Management of Companies are considered small businesses. The Finance one makes sense given the regulatory framework around banks and insurance companies that tends to favor scale.
We can also look at average payroll per employee by industry for small businesses. Note that payroll includes other benefits to the employee and isn’t exclusively salary.
So we can see that small business employment is still an engine of growth in the economy, but perhaps not what it once was. To try and figure out what sort of policies are conducive to small business employment growth we can look at the same information by state and identify which states are doing relatively well and which ones are lagging.
Small Business Employment at the State Level
The map below lets you explore on your own the evolution of small business employment by state. For instance, using the map you can see that California employs the most people in Information companies (though it’s also the most populous state, so it is better viewed normalized) and that the state has seen the highest percentage growth since 2010. The Information small businesses in California also have the highest payroll per employee.
However, staying with Information, Michigan and Massachusetts have also shown strong growth in employment. Massachusetts is also notable as the average payroll per employee is second behind California.
Those are perhaps fairly obvious due to the concentration of tech companies in San Francisco and Boston. Let’s take manufacturing as another example. Notably, Ohio, Michigan, and Indiana have shown strong growth rates in small business manufacturing employment while neighboring Pennsylvania has not. Perhaps it’s worth Pennsylvania policymakers’ time exploring why that’s the case.
Interactive Map of Small Business Employment Characteristics
In addition to looking at small business employment across the country, the table below allows you to explore small business employment in your home state. Take a look and see what jumps out to you.
Table of Small Business Employment Characteristics by State
About the data
The data is from the Census Bureau’s Statistics of U.S. Businesses. It comes out with a bit of a lag. The 2015 data was released in September of 2017. But, it provides a wealth of information at a fairly granular level of firm size.
I consolidated the data and made it available on GitHub.